Gold is often explained through simple rules:
Inflation rises → gold rises.
The Fed cuts rates → gold rises.
Interest rates rise → gold falls.
More than 50 years of evidence shows it isn't that simple.
Since gold began trading freely in the early 1970s, its major bull and bear markets have occurred under very different economic conditions. Sometimes inflation dominated. At other times, real interest rates, the US dollar, financial uncertainty or investment demand mattered more.
More recently, another force has become increasingly important: central-bank buying.
So what actually drives gold?
What the Research Tells Us
Research by the Federal Reserve Bank of Chicago covering 1971–2021 examined several commonly cited explanations for gold prices.
It found evidence for three particularly important influences: inflation expectations, real interest rates and pessimism about future economic conditions. Global economic growth was also important in explaining gold's longer-term price trend.
Importantly, the dominant factor changed over time.
Before 2000, gold prices tended to move closely with long-term inflation expectations. After 2000, inflation expectations became relatively stable while gold increased dramatically.
From 2001 onward, the Chicago Fed found that long-term real interest rates and pessimism about future economic conditions became much more important.
50 Years of Gold: The Macro Regime Matters
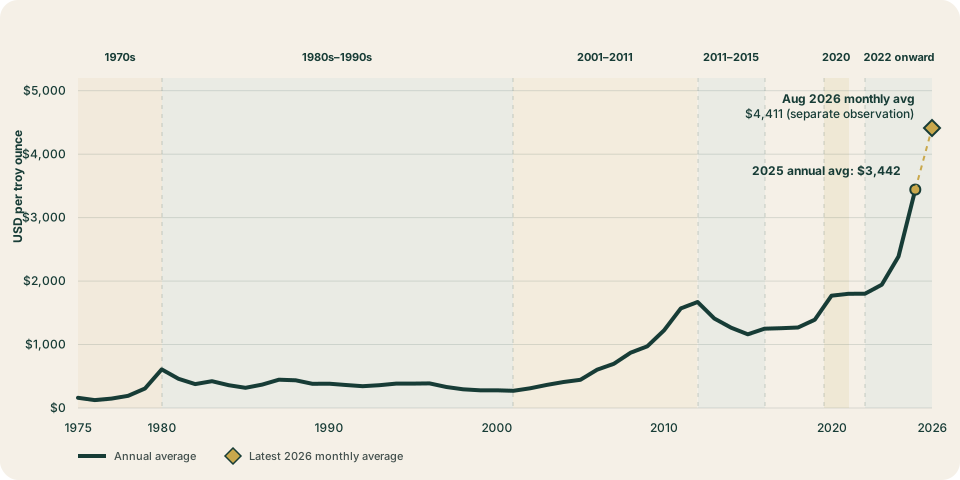
1970s — Inflation & Monetary Uncertainty
High inflation, oil shocks and concerns about monetary stability drove investors towards gold. Inflation expectations increased sharply and real interest rates were often low or negative.
Gold experienced an extraordinary bull market.
1980s–1990s — Disinflation & Attractive Real Returns
The environment reversed.
Aggressive monetary tightening under Federal Reserve Chairman Paul Volcker helped bring inflation under control. Inflation expectations subsequently declined and investors could earn more attractive real returns from financial assets.
Gold entered a prolonged bear market.
2001–2011 — Falling Real Yields & Financial Crises
Gold then experienced another major bull market — without 1970s-style inflation.
Real interest rates fell substantially while investors experienced the dot-com collapse, the Global Financial Crisis and European sovereign-debt concerns.
Between 2001 and 2012, Chicago Fed research found that long-term real rates fell by roughly four percentage points while the real gold price increased more than fivefold.
2011–2015 — The Reversal
Real yields recovered, the US dollar strengthened and extreme financial-system fears diminished.
Gold fell substantially from its 2011 peak.
2020 — Negative Real Yields & Extreme Uncertainty
COVID brought collapsing interest rates, extraordinary monetary and fiscal intervention and severe economic uncertainty.
Real yields became deeply negative and gold moved above US$2,000 an ounce.
2022 Onwards — A Different Force Emerges
This period is particularly interesting.
The Federal Reserve raised interest rates aggressively and real yields increased — normally significant headwinds for gold.
Yet gold proved remarkably resilient.
One important difference was central-bank demand.
Central banks purchased an exceptionally high 1,136 tonnes in 2022.
Purchases remained unusually high. Central-bank purchases exceeded 1,000 tonnes for three consecutive years from 2022 to 2024.
In 2024, purchases reached approximately 1,045 tonnes, compared with an annual average of about 473 tonnes between 2010 and 2021.
Gold Price Through 50 Years of Changing Macro Regimes
Three Common Misconceptions About Gold
1. “Gold rises when inflation rises”
Sometimes — but not always.
The 1970s strongly support gold's reputation as an inflation hedge. But the 2001–2011 bull market occurred without anything resembling 1970s inflation.
There is also an important distinction between current inflation and long-term inflation expectations.
Chicago Fed research found inflation expectations were particularly important during the earlier part of its 1971–2021 sample. After 2001, however, real interest rates and economic pessimism became more dominant.
Simply watching the latest CPI number is therefore not enough.
2. “Gold falls when the Fed raises rates”
Not necessarily.
The Federal Funds Rate is not the same thing as the real interest rate.
Gold produces no coupon or dividend. When investors can earn attractive inflation-adjusted returns from relatively safe assets, the opportunity cost of holding gold increases.
This is why real yields can tell us more than the Fed Funds Rate alone.
The Chicago Fed's long-run regression estimated that a one-percentage-point increase in long-term real interest rates was associated with approximately a 13.1% decline in the real gold price, holding the other variables in its model constant.
This is a historical statistical relationship — not a prediction that gold must fall by that amount whenever real yields rise.
3. “High real yields mean gold must fall”
Historically, rising real yields have been an important headwind.
But they aren't the only force affecting gold.
The post-2022 period demonstrates why.
Exceptionally strong central-bank purchases created an additional source of demand even while interest rates and real yields were elevated.
Gold therefore needs to be viewed as a market in which several forces can reinforce — or offset — one another.
What to Watch for Gold
REAL YIELDS ↓
Generally reduces the opportunity cost of holding gold.
US DOLLAR ↓
Historically tends to be supportive because gold is globally priced in US dollars.
INFLATION EXPECTATIONS ↑
Can increase demand for gold as a store of purchasing power.
ECONOMIC / FINANCIAL UNCERTAINTY ↑
Can increase safe-haven demand.
CENTRAL-BANK & INVESTMENT DEMAND ↑
Can provide an additional source of demand capable of offsetting some traditional macro headwinds.
Key takeaway: Don't watch the Fed Funds Rate in isolation.
The Bigger Picture
Fifty years of history suggests there is no single indicator that reliably determines gold prices.
The dominant driver changes with the macro environment.
In the 1970s, inflation and monetary uncertainty were particularly important. From the 1980s onward, real returns on financial assets mattered considerably. After 2000, falling real yields and concerns about economic conditions became major forces.
More recently, unusually strong central-bank demand has added another important dimension to the gold market.
So instead of asking:
“Will the Fed raise or cut rates?”
a better framework for understanding gold is:
REAL YIELDS + US DOLLAR + INFLATION EXPECTATIONS + RISK + CENTRAL-BANK / INVESTMENT DEMAND
Understanding how these forces interact tells us considerably more about gold than the direction of interest rates alone.
Research sources
- Federal Reserve Bank of Chicago, “What Drives Gold Prices?”, Chicago Fed Letter No. 464, 2021.
- World Gold Council, Gold Demand Trends: Full Year 2022 — Central Banks.
- World Gold Council, Gold Demand Trends: Full Year 2024 — Central Banks.
- World Bank, Commodity Price Data (The Pink Sheet), September 2026 release.
Money & Macro by NorthAxis
This post is for general educational purposes only and does not constitute financial advice or a recommendation to buy or sell any investment product. Investors should consider their own objectives, financial situation, and risk tolerance before making any investment decision.